How to change the layout of your pivot tables
This Pivot Table lesson shows you how to use the Pivot Table Field Layout to quickly change the layout of your pivot table. This allows you to try different pivot table layouts so you can be sure your data is being grouped, aggegated and displayed in the most useful way possible. It also allow you to generate multiple reports from the same underlying data without having to create multiple pivot tables.
A quick recap on creating a pivot table
In our first lesson, How to create a Pivot Table, we took a data table of sales data for three months and created a basic pivot table that showed daily sales over that time broken down by salesperson and by product sold. The resulting pivot table looked like this:
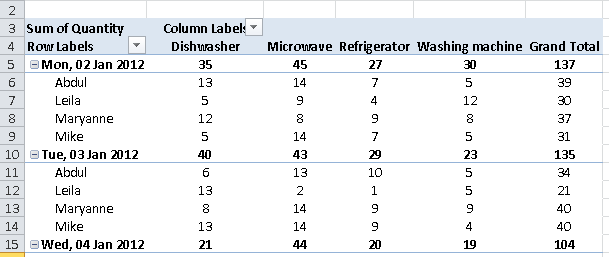
The Field list and Field layout for this pivot table looked like this:
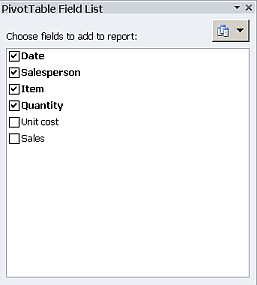
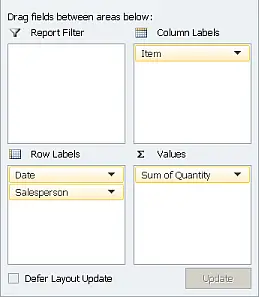
This lesson will focus on how you can change your pivot table layout using the Field List and the Field Layout panes.
Changing the Pivot Table Field Layout - a simple example
The Pivot Table Field Layout is the key to understanding how you can change the layout of your pivot table.
The great thing about pivot tables is that you can easily move fields around in the field layout to see whether a certain layout tells the story about your data that you want it to. Excel changes your layout almost instantly, so you can try different scenarios very quickly and easily. That said, there may be a delay in updating the layout of your pivot table if you have a lot of data or a complex layout. You can use the Defer Layout Update option to stop excel rebuilding the pivot table layout every time you make a change to the field layout.
- To change your layout, the quickest way is simply to drag and drop fields between (or within) the different areas.
- A simple example might be to show the rows by Salesperson and then Date, rather than the current layout of Date then Salesperson.
- To do this, simply click on the Date label and drag it below the Salesperson label:
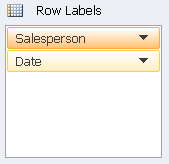
- The pivot table changes to look like this:

- As you can see, we now have Abdul's sales first, with a row for each day on which he sold at least one product (dates on which he didn't sell anything aren't shown). If you were to scroll down the pivot table, you would see each sales person listed in turn, with their sales by day as they are for Abdul.
- This isn't necessarily the most useful way to show this data, so you might choose to collapse the date field to show only the names of the sales people and their overall sales. Simply click the
 button next to each sales person to make the spreadsheet look like this:
- Of course, another way to get a similar result to that above would be simply to remove the date field from the Field Layout area, to get this:

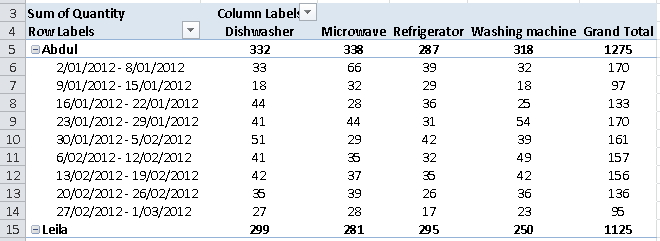
- Another option would have been to aggregate the Date data and show it grouped by week, rather than showing every day. The example below shows the result of doing that. Note that this isn't done by changing anything in the field layout - you do it by operating directly on the pivot table itself. You can learn more about grouping data by date in this lesson (opens in a new window):
Pivot Table Layouts - some more examples
Let's look at some different scenarios for displaying our report data. You can download the spreadsheet used in these examples from the Worked Examples box in the right column so you can reproduce what you see here.
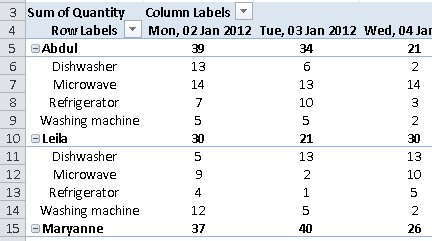
Example 1 - Show sales by salesperson then by item
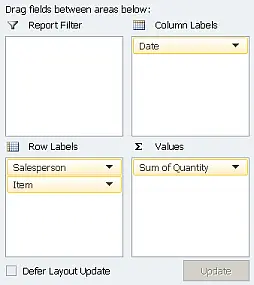
- Change the pivot table field layout to look like this:
- The pivot table changes to look like this:
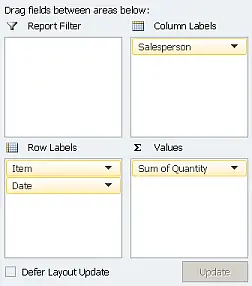
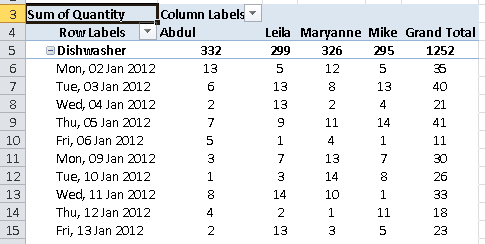
Example 2 - show sales by item and then by date, with salespeople listed in columns
- Change the pivot table field layout to look like this:
- The pivot table changes to look like this:
Summary
As you'll see from these examples, and from experimenting with your own pivot tables, a lot of the power of Pivot Tables comes from the ability they give you to quickly and easily change the layout of your report table. We covered some faily simple examples here. In our next lesson, we'll look at the only element of the Pivot Table Field Layout we haven't looked at yet - the Pivot Table Report Filter.
Download worked examples
Join our mailing list
Our Comment Policy.
We welcome your comments and questions about this lesson. We don't welcome spam. Our readers get a lot of value out of the comments and answers on our lessons and spam hurts that experience. Our spam filter is pretty good at stopping bots from posting spam, and our admins are quick to delete spam that does get through. We know that bots don't read messages like this, but there are people out there who manually post spam. I repeat - we delete all spam, and if we see repeated posts from a given IP address, we'll block the IP address. So don't waste your time, or ours. One other point to note - if you post a link in your comment, it will automatically be deleted.
Comments on this lesson
Fix a certain view
Hallo, can someone help me? Every time i create a pivot I need to custom make it. Is there a way in which I can preset my preference so that every time I create a new pivot it looks as my preference.

i thank this team to put things so clear, it made complex things simple for me