Use the Pivot Table Report Filter for even better pivot tables
In this lesson, we'll look at how to use the Pivot Table Report Filter. This is one of the areas available in the Field Layout section of the Pivot Table Fields pane. We covered the other areas in an earlier lesson (How to change the layout of your pivot tables - opens in a new window) but the Report Filter deserves a lesson all of its own.
What the Pivot Table Report Filter does
The Pivot Table Report Filter allows you to create a pivot table and then use one or more fields from your raw data as filters on the pivot table. Some examples of how you could use Report Filters include:
- Show sales by item, and use Salesperson as a filter, so you can generate a separate report of sales by each salesperson.
- Show sales by sales person broken down by week, and have a filter for Item Sold. Changing the filter changes the pivot table to show only the item(s) selected in the filter.
We'll work through the first of these examples as part of this lesson (the second example is similar to the first in terms of the steps you'd need to take).
You can download a copy of the spreadsheet we used to create this lesson from the Worked Examples section to the right.
Using the Pivot Table Report Filter
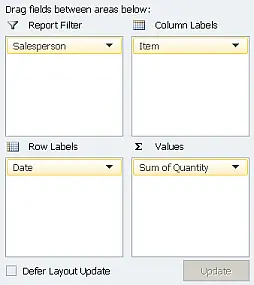
Using the Pivot Table Report Filter is easy - you simply drag one or more fields into the Report Filter area, as shown in this example:
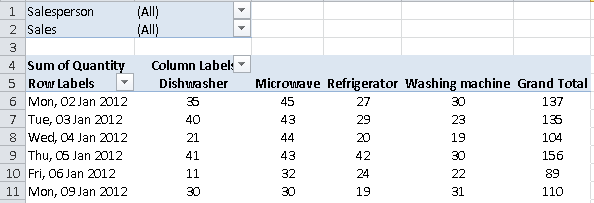
When you do this, the Pivot Table changes to look like this:
Example - Sales by Item, filtered by Salesperson
In this example, we'lll filter by Salesperson, so we can generate a report of sales by item.
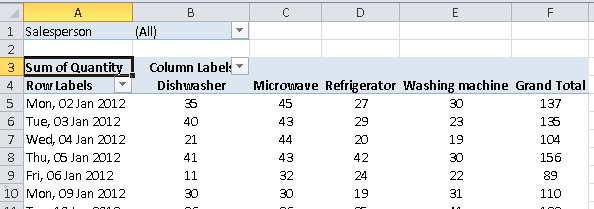
- Change the Report Layout so it looks like this:
- Your pivot table will change to look like this:
- The filter defaults to (All) but you can now filter the table below by clicking the
 button. You'll then see this:
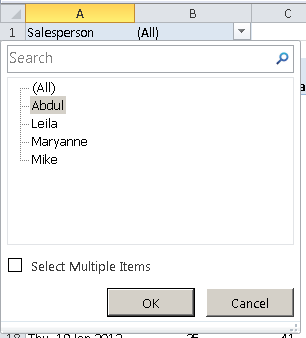
- In this case, I have clicked on Abdul, but I haven't yet clicked OK to apply the filter.
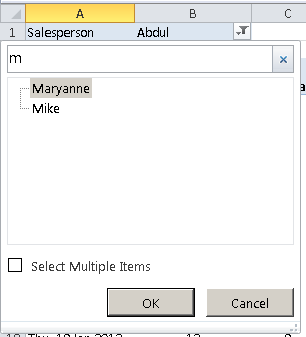
- Rather than clicking one item (Abdul), then clicking OK, I could do a search. This is useful if my list of salesperson is very long. But even in this case it might have some use. In the example below, I've typed the letter M into the search box, and the list has been filtered accordingly to only those people whose names start with M:
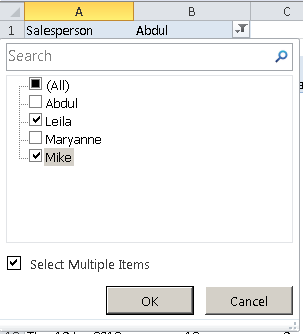
- Another option would be to check the Select Multiple Items option, so you can include more than one item in the filter, as shown here where I've cleared the seach and then selected Leila and Mike:
- The pivot table will be updated when we click OK. Based on that last example, the Report Filter field now looks as follows:
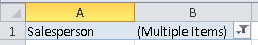
- Note that the Filter icon has changed to
 to indicate that the list is filtered. The filter field has also changed to show what the list is filtered by. Note that if we'd chosen just one name, that name would be shown instead of it saying Multiple Items.
Multiple fields in the Report Filter
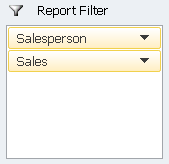
At the start of the lesson, we showed an example of a Report Filter with two fields in the Report Filter - Salesperson, and Sales. This would allow us to filter first by Salesperson, and then drill further into the sales for the selected salesperson (or salespeople) to refine the pivot table report even further:
Another example - which you could try for yourself - would be to set up a Report Filter that includes Salesperson and Item, and then filter to show a report of the sales, by day, of Televisions that Mike has made.
Summary
This lesson showed you how to use the Report Filter in your Excel Pivot tables. Using the Report Filter allows you to create a report where you can easily filter out data that you don't want to see, or to quickly produce multiple versions of the same report (e.g. sales by salespeople.).
Our Comment Policy.
We welcome your comments and questions about this lesson. We don't welcome spam. Our readers get a lot of value out of the comments and answers on our lessons and spam hurts that experience. Our spam filter is pretty good at stopping bots from posting spam, and our admins are quick to delete spam that does get through. We know that bots don't read messages like this, but there are people out there who manually post spam. I repeat - we delete all spam, and if we see repeated posts from a given IP address, we'll block the IP address. So don't waste your time, or ours. One other point to note - if you post a link in your comment, it will automatically be deleted.
Hi,
where does Excel hold values that user selects in report filter field?
In case if one (or all) value is selected it shows the selected value in the field, but in case if multiple values selected - it displays "Multiple values", but it has to store those selected values somewhere - otherwise how would it filter pivot table rows?
So, does anyone knows where is that place?
Thanks in advance!