How to create a Pivot Table in Excel
Excel's PivotTable feature is an incredibly powerful tool that makes it easy to tabulate and summarize data in your spreadsheets, particularly if your data changes a lot. If you are finding yourself writing lots of formulas to summarize data in Excel (using functions such as SUMIF and COUNTIF) then PivotTables can save you a lot of time and work and give you insights into your data that are otherwise too hard to discover. Not only that, but they also allow you to quickly change how your data is summarized with almost no effort at all. This lesson will show you how to create a simple PivotTable in Excel to summarize a set of daily sales data for a team of several sales people.
What you'll learn in this lesson
This lesson takes you through the following steps to build an Excel Pivot Table"
- Set up your data in Excel so it is in a format that is compatible with creating a PivotTable.
- Insert a PivotTable using that data into a new worksheet inside your workbook
- Add fields from your data to your PivotTable layout so you can see that data in summary form.
- Change the layout of your PivotTable report to reflect different views on the same data.
The data we'll work with in this example is an Excel table that has two months of daily sales data for a team of four sales people, broken down by product. The first few rows are shown below:
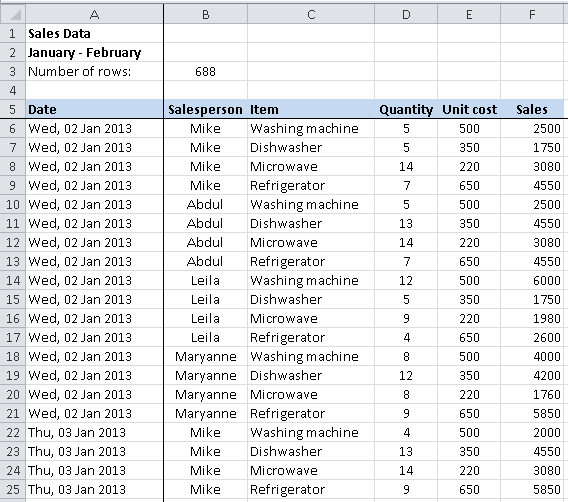
In fact, this spreadsheet extends down for 688 rows of sales data, for all of January and February (you can download a copy of the spreadsheet here). So while you might look at the data in the table above and think "I could summarize that quickly by hand or with a few clever formulas", the likelihood is that it would all get too much - and would certainly take too long to do by hand. That's where PivotTables are by far the best solution - you'll be able to convert this data in under a minute, and be able to get different summaries with a few clicks of the mouse.
Getting started with PivotTables - make sure your data is ready
There are some important rules you need to follow if you want to create a PivotTable from your data:
- Your data should be organized in columns with headings. These headings will be used when you create the PivotTable, and things will get very confusing without headings.
- Make sure there are no empty columns or rows in your data. Excel is good at sensing the start and end of a data table by looking for empty rows and columns. If it finds an empty row or column, it assumes your data stops at that point.
- A quick way to check if your data is ready to be used in a PivotTableis to click a single cell anywhere in the data table, then press SHIFT+* (or CTRL+SHIFT+8). This automatically selects the whole table. If any data remains unselected, you need to check for empty columns or rows within the data table.
- Note that empty cells within your table are OK. What isn't OK is a whole row or a whole column of empty cells.
- Consistent data in all cells.
- If you have a date column, make sure all the values in that column are dates (or blank).
- If you have a quantity column, make sure all the values are numbers (or blank) and not words.
At this point, if everything is looking OK, you're ready to move on to the next step.
Create a blank PivotTable
To start your PivotTable, follow these steps:
- Click on a cell in the data table. Any cell will do, provided your data meets the rules outlined above. In fact, at this point it's all or nothing - select the whole table or just one cell in the table. Don't select a few cells, because Excel may think you are trying to create a PivotTable from just those cells.
- Click on the Insert menu and click the PivotTable button, as shown below.
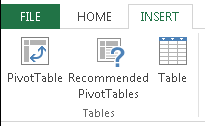
- Note the feature to see Recommended PivotTables. This is the fastest way to create a PivotTable, although you may still need to modify it to match your requirements. In this lesson, we'll choose the PivotTable button so you can learn how to build a PivotTable from scratch:
- Click on the Insert menu and click the PivotTable button, as shown below.
- The following dialog box will appear. You'll use this to specify where the data for your pivot table lives (in an Excel table or range, or an external data source, such as a database) and where the pivot table you are creating will be placed.
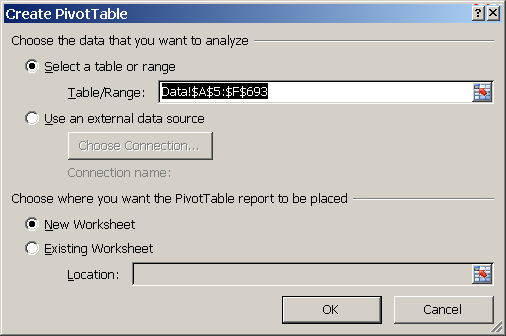
- Note that the Table/Range value will automatically reflect the data in your table. You can click the icon on the right side of this field to change the Table/Range value if Excel guessed wrong. Alternatively, you can choose an external data source such as a database (this is an advanced topic and is outside the scope of this lesson).
- Also notice that you can choose where the new PivotTable should go. By default, Excel will suggest a New Worksheet, which I think is the best choice unless you already know you want it on an existing worksheet.
- Be aware that if your data changes a lot, or you find yourself changing the PivotTable layout, then refreshing the data in your PivotTable can result in the PivotTable changing shape and covering a larger area of the worksheet where you place it. When this happens, any data in that part of the spreadsheet will be overwritten and lost.
- In other words, putting a PivotTable on the same page as your data or other information can cause you real headaches later on, which is why I recommend New Worksheet as the preferred option.
Once you've completed your selections, click OK. Assuming you chose the New Worksheet option, Excel will create a new worksheet in the current workbook, and place the blank PivotTable in the worksheet for you. You are now ready to design your PivotTable.
Designing your PivotTable layout.
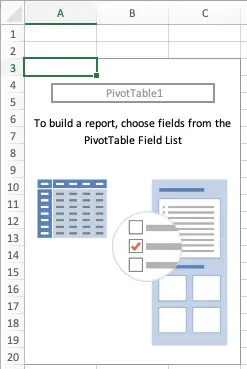
You should now be looking at a new worksheet that is ready for you to set up your PivotTable.
- You'll notice see three separate elements of the PivotTable on the screen:
- First is the PivotTable itself, which is on the left. This will be blank to start with.
- First is the PivotTable itself, which is on the left. This will be blank to start with.
- On the right you'll see the PivotTable Fields section which contains the Field Name section and the field layout area.
- The Field Name section should show the column headings from your data table. If not, you may need to check that you selected the whole data table before starting.
- If you don't see this section, make sure to click inside the PivotTable on the left. If you click on any cell that is outside the PivotTable on the left, the PivotTable Fields box will disappear. You can make it reappear simply by clicking inside the PivotTable report again.
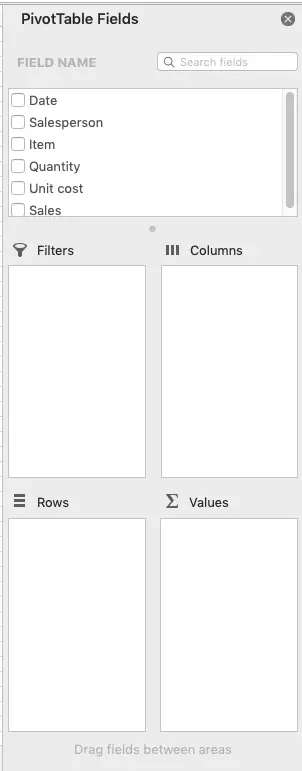
- Below the fields are four separate boxes. You'll create your pivot table layout by dragging fields into those boxes. You can drag multiple fields into each box, although this may make your pivot table large and complicated.
- Filters: this allows you to put a field outside the table itself and use it to filter the data in the table. In our case, you could drag the Item field in here. The filter will then contain a dropdown of all the different item listed in that column in our data.
- Rows: This will be used to show the data you have in rows. You could drag Salesperson into the Rows box - all the sales people will then be listed down the site.
- Columns: This is similar to the Rows box. If you drag an item in here, the values will be listed along the top of the table. In our example, we will put Items here (rather than in the Filters box).
- Values: Finally, the Values box is where your data will be collated into the actual report. You should drag items with numeric values into this box. Excel will try to calculate them. In our example we'll use Quantity but we could also use Sales.
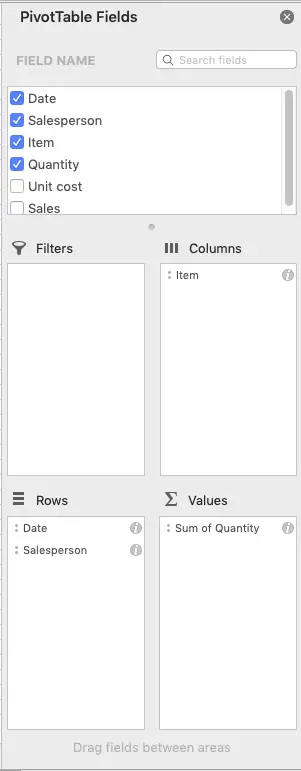
- Tip: You can let Excel decide where to put your fields by simply checking each field you want to include. Excel will do its best to decide where to place them. However, Excel sometimes guesses wrong, so manual selection is likely to be faster.
- Here's how I configured the fields for the example above:
- The PivotTable report that is generated from these selections looks like this:
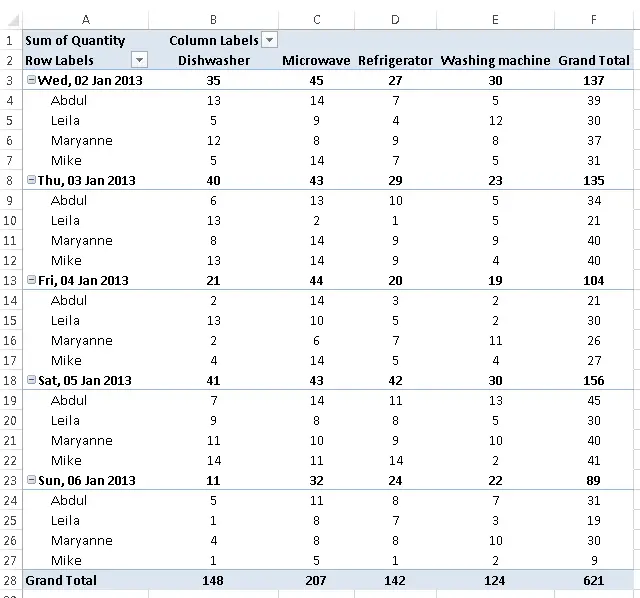
- At this point, the PivotTable has created a table that shows the number of each product sold by each sales person on each day.
Changing your PivotTable
So far, we've seen how quickly a PivotTable can create a report that would have taken hours to produce by hand. Now, let's try changing the PivotTable to show the report another way, i.e. show Products down the side, and Sales people across the top.
- Click inside your PivotTable report (i.e. the report shown above). The PivotTable Field List should reappear.
- Change the layout of your PivotTable to look like this:
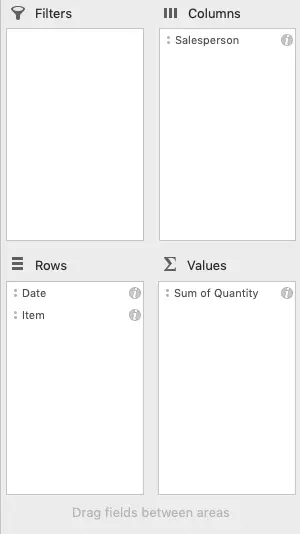
- When you make this change, you'll see your PivotTable change instantly to reflect the new layout (unless you chose Defer Layout Update - this feature is useful if you have a lot of data, and changing the layout of your PivotTable takes a long time to recalculate)
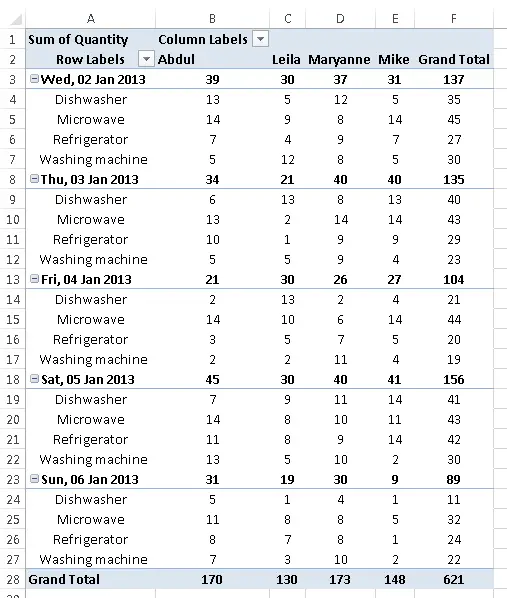
The speed with which you were able to make this change demonstrates the real power of PivotTables - the ability they give you to tabulate data quickly, and then rearrange your data into different reports almost instantaneously.
Hopefully this lesson has given you what you need to get started with PivotTables. If you have any questions or comments about this lesson, or specific scenarios you need help with, you can either leave a comment using the form below, visit our PivotTable page here for more lessons.
Our Comment Policy.
We welcome your comments and questions about this lesson. We don't welcome spam. Our readers get a lot of value out of the comments and answers on our lessons and spam hurts that experience. Our spam filter is pretty good at stopping bots from posting spam, and our admins are quick to delete spam that does get through. We know that bots don't read messages like this, but there are people out there who manually post spam. I repeat - we delete all spam, and if we see repeated posts from a given IP address, we'll block the IP address. So don't waste your time, or ours. One other point to note - if you post a link in your comment, it will automatically be deleted.
Comments on this lesson
nice thanks
nice thanks
its very easy to under stand.
its very easy to under stand.
Agriculture Research
Simple and very helpful script
Thanks, it helped a lot
Thank you!
I am amazed of the quality of this tutorial. You fully deliver the goods in five minutes! Please do keep your quality as high as this, and you will prosper.
A side note:
This cannot be done easily in oracle sql using the pivot statement, because Oracle is unable to make it dynamic.
Excel wins this round hands down :)
For a very new person like me
For a very new person like me it's really awsome keep up the great work
great work easily explain
great work easily explain complex process.
Pivot Table
Is there a LINK I can use for practice........?
Thanks
No totals displayed for a
No totals displayed for a calculated field
The Sum of Field2 calculates how many times the value in Breach dips below zero but does not show the sub-total.
Why? please HELP!!!
Hi Sandra
Hi Sandra
Can you provide more information? If you want to send an example of your spreadsheet for me to look at, use our Contact Form to get in touch and I'll reply with an email address that you can send the example to.
Regards
David
Pv file report
great ideas, i need to learn more on Pv lessons
Thank you. Very easy to
Thank you. Very easy to understand.
Thank you for making it very
Thank you for making it very easy.
excellent example...
excellent example...
This is absolutely helpful.
This is absolutely helpful. Many Thanks for the information.
Nice Tutorial- Plz provide worksheet for download to practice
Dear, Plz provide worksheet for download to practice this example.
Worked example file now available
Hi Sumit
The spreadsheet I used to create this lesson is now available to download from the top of this page. Hope it helps!
David
The downloadable spreadsheet
The downloadable spreadsheet from the top right of the page does not contain the same data from your tutorial...
Fixed!
Hi Rachael
Sorry about that - I've now fixed it. Thanks for pointing it out.
Regards
David
I really love this leasson
I really love this leasson
Nice one! Thanks!
Nice one! Thanks!
There is a web version pivot
There is a web version pivot table at here
Format
How would keep the format you've given to the table after changing what it shows? I've changed the alignment while wraping text, but after filtering with a criteria it goes to the same format it had when first created, it does not keep it.
Amazing post - good prerequisite for things to come
Hey,
great article. I have referred several of my colleagues to this as a starting point. As the pivot table functionality has been improved so much since the old days (Excel 2003) the basic usage of it is really a prerequisite to use the "newer" tools like PowerPivot (which is so amazing as it drastically reduces time flattening your data as preparation for pivots).
Some of my colleagues stated that it took them a little longer than 5 minutes, but 10 or even 15 minutes of course is still fine for a topic with that complexity.
ms excel course online
If you want to learn Microsoft Excel, there are several places on the net that offer online courses. The one I personally like is http://www.onlinecourses.trainedge.co.in/ms-excel-training-with-microsof.... They have videos and pdf course packs like most online course. But they also have lots of assignments you can use to practice the concepts. There are simulated exercises also which are basically guided practice sessions and very helpful.
How to Learn Pivot Table in Excel 2010?
I am a new operator. I know how to work Excel but I can't operate Pivot Table. I want to create a web data/date sheet for my official work. I request to you please give me all of note and information that I can create data sheet and see all of data table easily.
This lesson should cover it
Hi Moshe
Thanks for your comment. I believe this lesson should have everything you need to know about setting up a Pivot Table in Excel 2010. If you have any specific questions after reviewing the lesson, please feel free to post them in a new comment.
Regards
David
Thanks a Lot.
Thanks a Lot.
A simple and easy understandable method of teaching by you is highly appreciatred
Simply superb
Thanks for simple way teaching it, it helped me.
for pivot table
Thanks for providing me this page . simly & great page
Pivot Table introduction
Very useful introduction to the use and set up of pivot tables .
Very easily explained ,
Very easily explained , Thanks a lot for your contribution.
Excellent Excel
I'm on excel from last 5 years, during my studies & now at work. It has got plenty of features, which I'm yet to learn & you're the one helping me with it.
Thank you!!
Good explanation of subject,
Good explanation of subject, very usefu. Thanks!
I have some doubts
First of all thanks for the tutorial. I tried applying the pivot table on my data but didn't find what I was looking for.
In the attached file is the data of my purchases from these creditors, now I want to know how much I have purchased from each creditor also I want the other figures mentioned in the headings, can I do that using Pivot Tables ?
Sorry this is the file containing the data
Please find the attachment
Yes, a PivotTable is perfect for this
Hi Vaibhav
Your data is structured perfectly for what you're trying to do with a PivotTable.
- Click on a cell anywhere inside your data table
- Follow the steps above to create your PivotTable
- Add the Name of Creditor field to the Row Labels area.
- Add each of the columns you want to analyse to the Values area (Gross Total, Oms Purchases etc)
- If the PivotTable gives you the Count of any of these columns, then click each field and choose Sum in the Summarize value field by section.
That should give you what you are looking for.
David
Simplified teaching
Nice job buddy keep it up...
lesson on pivot table creation
It's simply superb. This explanation is easy to understand, also quick and effective. Keep publishing. Thank you.
solution
How to find the similar data from 2 different tables or the data which is not in the second table ?
eg: as per attached excel, highlighted (yellow) are not in other table
thanks a lot for the
thanks a lot for the information ... very helpful...
Perfect, just what I was
Perfect, just what I was looking for to gain an understanding and now it seems so much easier
Excellent Tutorial
Excellent Tutorial
Thank You!
I have taken pivot table training in the past, but this was a great quick reference! Thanks so much!
hai excellant thanks for your hints.
I know how to work Excel but I can't operate Pivot Table.Thanks for your info sharing to others. we expect more more hints like this.
I am surprised of your quality of deliver the concept in few min.
Thanks a lot.
Very Helpful! Thank you.
Great 5-Minute lesson and a handy refresher. Thank you!
Nice Information About Pivot
Nice Information About Pivot table...
PROCESSING POWER PROBLEM - PIVOT TABLES?
Very good tutorial.
I've successfully avoided the use of Pivot Tables, perferring to create tables on my own using the various formulae Excel provides, for well over a decade. Now I find my machine grinding to a halt when working with data blocks of about 65,000 rows and about a dozen columns. I've limited cell references (e.g., COUNTIF(A1:A65000,F2) rather than (COUNTIF (A:A,F2)) ,eliminated references across workbooks and even consolidated data on worksheets to limit cross-sheet references, but STILL it is taking eternities to process or freezing altogether, even when I move my work to more powerful work stations. I'm afraid to ask, but might Pivot Tables provide a solution or does a Pivot Table, say, counting 65,000 rows take just as much horsepower as a 65,000-row COUNTIF / COUNTIFS statement?
Help!
R
PivotTables perform far better for large data sets
Hi R.
I'm not sure I'd describe "avoiding" PivotTables as success .... if you spend the time to dig into the functionality they offer, I have no doubt you'll find yourself wondering why you put it off so long - and your performance issues will disappear, or will at least become much less of a problem. Bear in mind that COUNTIF and COUNTIFS have a lot of heavy lifting to do (as does any function with IF in its name)..
PivotTables work by taking a copy of your data and storing them in more efficient format than standard Excel rows and columns. This is known as the pivot cache. All changes you make to the table are applied to the data in the pivot cache rather than the raw data, and happen very quickly compared to what you're seeing when your spreadsheet recalculates. As new data is added to the source data, you can then manually refresh the pivot cache which in turn updates the PivotTable (in fact, you'll simply be "refreshing the data" - you won't see any references in Excel to "refreshing the pivot cache" or even any references to the pivot cache - that all happens behind the scenes).
Not only that, but Excel 2013 will automatically use the same pivot cache for each PivotTable you create in that spreadsheet file. This means you can have multiple worksheets with multiple PivotTables, all using the same source data, which makes PivotTables considerably more efficient than creating multiple worksheets with different reports that each references and calculates from the sheet containing the raw data.
If you're using earlier versions of Excel you have the option when creating a new PivotTable from the same source data to re-use the pivot cache by selecting "Yes" when asked if you want use less memory with your new PivotTable.
After all this, you might also like to consider PowerPivot, which was a free downloadable extension in Excel 2010 but is now a standard feature in Excel 2013. It's basically PivotTables on steroids - check out the videos on this page:
http://www.microsoft.com/en-us/bi/powerpivot.aspx
I hope that helps. Feel free to post again if you need help to get your PivotTables beyond the basics covered in this lesson.
Regards
David
Pivot Table
Excellent tutorial and well explained.
pivot table lesson comments
i really like the way of your tutorial of pivot.
Thanks & Regards
Neeraj Sachdeva
Thanks
Realy very useful...thanks
Pivot tables
Wow. This 5minute lesson was very informative and easy to understand. Great stuff. Keep it up!
Absolutely fabulous coverage
Absolutely fabulous coverage of the topic in an easy to understand manner. Thanks and keep it up.
very helpful.keep up the good
very helpful.keep up the good work
Pivot Table
superb...thank you so much, i learnt it in few mins.
Simple and very effective
Simple and very effective tutorial. Thanks and keep up the good work
Helpful Post!
Thank you, its a great review! Concise and relevant.
Brilliant
This short tutorial is absolutely brilliant. My eyes have been opened to the usefulness of pivot tables. Thanks for this!
Pivot Table
Thank You.... Its easy to understand and i can able to create the Pivot ... good Explainations...
Excel pivot table
I had to laugh at your comment about Bill Jelen's book. I am looking at the internet and studying the book. You are right the combination is educational.
Pivot tables
Hi,
Is there a way we can compare 2 pivot tables with similar information to spit out the difference betwen the two ? The source of obtaining the data for both is different...
Example I have timesheets and have created a pivot table listing name, positions and days worked I now want to compare that with what actually gets paid by payroll. My issue is that being a large company personnel move from one cost centre to another filling in roles and sometimes payroll forget to change the cost centre thus creating the difference. Can you please suggest a way to compare the two? Thanks
Really helpful. Thanks!
Really helpful. Thanks!
very useful
very useful
Hi
It useful enough to the beginner user of Pivot Table in just few minutes....It would more worth-full if you could use a complex data sheet ..
However, this is great...have good insight about pivot tabble..
GR
Hi GR
Hi GR
There is a downloadable spreadsheet from this lesson available in the right sidebar.
Regards
David
Certain words or group of numbers should equal 1
I need to know how many of the "accepted" are in each worklist. I also need it to calculate from a starting number, since I'm just starting to track it this way, say 437 for worklist 3095 and 130 for worklist 3096 but, I also need it to calculate when something is removed from each or those lists from a seperate worksheet
Thank you
Very useful - thanks a lot :))
Hi
Hi
if i then add more data to my original table how does this get picked up into my pivot table?
For example with the example above, when marchs data is added to the origanl data table, how do you get this to appear in the pivot table, and therefore into my pivot graphs?
Thanks
Adding new data to your pivot table
Hi Jen
Thanks for your comment. I realised I hadn't covered this, so I added a new lesson on how to add new data to an existing spreadsheet.
Regards
David
Excel Tutorials
Thank you very much.... The tutorials are very easy to follow..
Best of luck with your future efforts
Good and easy example in your tutorial
Really nicely explained and easy textual one. Thanks for the same , I also find a example in this video in Youtube , just for reference
https://www.youtube.com/watch?v=QTy3fO5Pkyw
Keep extending such tutorials.
Pivot Tables
Very simple and clear. Thank you!
Thank you
Just wanted to say this was very helpful. I am just beginning to try and learn more famously useful Excel tricks and this lesson was very well done.
very easy to understand
Thanks for this simplified way. Very useful for my daily work.
Formatting pivot tables
Sometimes you need your pivot table to be shown as a simple one, to do so follow:
http://runakay.blogspot.com/2017/07/showing-pivot-table-as-simple-table-...
honestly it was too wordy it
honestly it was too wordy it needs more pictures
How to create a pivot table
Hi colleagues,
Can someone show me how to create a pivot table with the practicable example so that I can take over from there.
Thanks Ohide Gabriel
How to create a pivot table
Hi colleagues,
Can someone show me how to create a pivot table with the practicable example so that I can take over from there.
Thanks Ohide Gabriel
Wonderful, keep up the good work. I understood the concept in five minutes flat